COVID-19. HOW TO CLEARLY COMMUNICATE THE SIGNIFICANCE OF EXPONENTIAL GROWTH
Assessing the spread of the Covid-19 pandemic often falters because the nature of exponential growth is difficult to grasp, and the dramatic scale of the spread cannot be captured in conventional graphs. In a publication from the 27 April, a team led by Salzburg psychologists, Florian Hutzler and Stefan Hawelka, has been able to show that logarithmic-scaled graphs can depict growth dynamics in an understandable way. These findings are highly significant, especially for the rapid and efficient communication of early phases in exponential growth and the emergence of another wave in the epidemic.
We humans seriously underestimate the almost explosive growth of exponential processes without realising this misjudgement, psychologists say. In fact, we are convinced that our intuitive (false) statistics are correct, which suggest that developments are purely lineal, like a beam.
Growth of the COVID-19 pandemic is underestimated
Therefore, the growth of the COVID-19 pandemic was, and still is, underestimated – by the public as well as by politicians. “The human tendency to massively underestimate exponential growth is unrelated to an individual’s mathematical aptitude or experience” says Florian Hutzler, first author of the study “and the linear-scaled graphs with which epidemic data are usually conveyed in the media do not help to correct this misconception.” Exponential growth is a process in which the increase is always proportional to the amount already present. For instance: interest at the bank, the interest rate refers to the current (constantly increasing) capital.
Publication in the Royal Society’s journal Open Science
Florian Hutzler, Stefan Hawelka and their team at the University of Salzburg were able to demonstrate in a paper published on the 27 April in the Royal Society’s journal Open Science that logarithmic-scale graphs (although less familiar to us as such) allows an almost perfect visualisation of the course of a COVID-19-type exponential growth.
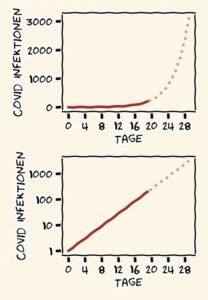
The researchers presented 122 test subjects with illustrations showing the spread of a hypothetical epidemic for the first 20 days. The test subjects had to estimate how many people would be infected after 30 days. For half of the graphs, the usual linear representation was chosen – i.e. the number of cases increased in increments of 1000, 2000, 3000. The other graphs showed a logarithmic representation, in which the number of cases increased by 10, then by 100 and lastly by 1000. “Crucially, in the logarithmic graph, the exponential function – which is intangible to us – becomes a straight line. Therefore, the increase becomes obvious”, say the researchers, “and although the logarithmic representation is unfamiliar to most people, they can still visualise the straight line and thereby come to a reliable prediction.
_________________________
Illustration
In the upper, linear graph, the explosive growth of an epidemic is not recognisable from the figures of the first 20 days. Relying only on their intuition, both experts and regular people will massively underestimate the actual extent of new infections on the 30th day. The same data in the figure below have a different effect.
Although we are unfamiliar with the logarithmic representation of the high axis, this disadvantage is offset by the fact that the exponential function, which is otherwise difficult to grasp, becomes a straight line. We can easily visualise the continuation of this line and, even as regular people, correctly estimate the extent of the new infections. (Image: © Florian Hutzler)
________________________
This finding is particularly important for the rapid and efficient communication of early phases in exponential growth and the emergence of another wave in the epidemic. As the second wave in Austria in November 2020 showed, the onset of exponential growth is difficult to recognise at the beginning. “And by the time we do recognise it, we are already in the middle of a growth dynamic that can no longer be stopped without major intervention”, says Hutzler.
________________________
Publication
Florian Hutzler, Fabio Richlan, Michael Christian Leitner, Sarah Schuster, Mario Braun und Stefan Hawelka: Anticipating trajectories of exponential growth. In Royal Society Open Science. https://doi.org/10.1098/rsos.201574
Further information: ccns.sbg.ac.at/people/hutzler